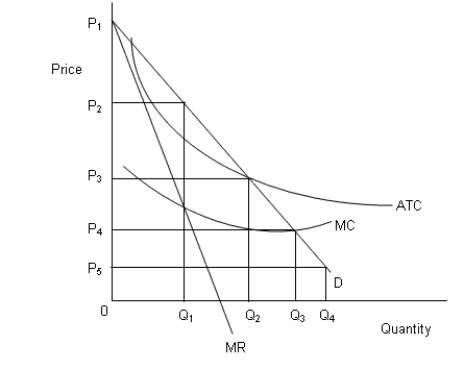
The figure below shows revenue and cost curves of a natural monopoly firm.Figure 14.1
 In the figure,
D: Demand curve
MR: Marginal revenue curve
MC: Marginal cost curve
ATC: Average total cost curve
-Which of the following is an example of the opportunity cost involved with social regulation?
A) The monetary costs of hiring administrative assistants to fill out OSHA safety reports
B) The environmental costs of pollution control required under the Clean Air Act
C) The monetary costs of laboratory trials required to try out a new drug
D) The lives that are lost because new drugs are not introduced quickly
E) The monetary cost of manufacturing a life saving drug
Correct Answer:
Verified
Q54: The figure below shows revenue and cost
Q55: In the following figure, the first panel
Q56: In the following figure, the first panel
Q57: The figure below shows revenue and cost
Q58: The figure below shows revenue and cost
Q60: The figure below shows revenue and cost
Q61: In the following figure, the first panel
Q62: In the following figure, the first panel
Q63: In the following figure, the first panel
Q64: In the following figure, the first panel
Unlock this Answer For Free Now!
View this answer and more for free by performing one of the following actions

Scan the QR code to install the App and get 2 free unlocks

Unlock quizzes for free by uploading documents