The figure given below represents the marginal revenue product (MRP) and the marginal factor cost (MFC) of a resource in the resource market.Figure 14.3
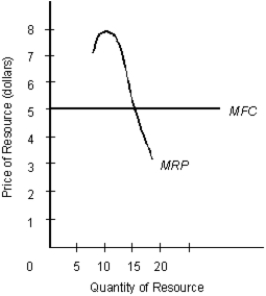
-Consider the resource market shown in Figure 14.3. Given that the resource market is perfectly competitive, how many units of the resource will be purchased when the market is in equilibrium?
A) Less than 10 units
B) 10 units
C) Between 10 and 15 units
D) 15 units
E) More than 15 units
Correct Answer:
Verified
Q25: The table below shows the total output
Q26: The table below shows the total output
Q27: The table below shows the total output
Q28: The figure given below shows the marginal
Q29: The figure given below represents the marginal
Q31: The following table shows output per hour
Q32: The figure given below shows the marginal
Q33: The figure given below shows the marginal
Q34: The following table shows output per hour
Q35: The following table shows output per hour
Unlock this Answer For Free Now!
View this answer and more for free by performing one of the following actions

Scan the QR code to install the App and get 2 free unlocks

Unlock quizzes for free by uploading documents