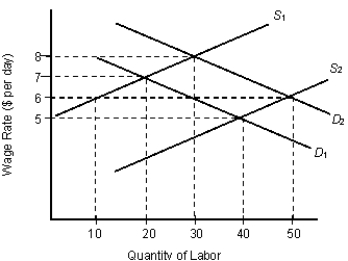
The figure given below shows the demand curves (D1 and D2) and supply curves (S1 and S2) of labor in the labor market.Figure: 16.2
-Which of the following is not a reason for compensating wage differentials?
A) The risk involved in certain jobs
B) An excess supply of workers in some industries
C) A high probability of staying away from home
D) To attract more laborers in risky professions
E) Unpleasant working consditions
Correct Answer:
Verified
Q6: Scenario 14.1
A worker in Firm A earns
Q7: Scenario 14.1
A worker in Firm A earns
Q8: The figure below shows the supply curve
Q9: The figure below shows the supply curve
Q10: Scenario 14.1
A worker in Firm A earns
Q12: The figure below shows the supply curve
Q13: The figure below shows the supply curve
Q14: The figure given below shows the demand
Q15: Scenario 14.1
A worker in Firm A earns
Q16: The figure below shows the supply curve
Unlock this Answer For Free Now!
View this answer and more for free by performing one of the following actions

Scan the QR code to install the App and get 2 free unlocks

Unlock quizzes for free by uploading documents