The table below shows the distribution of income in the U.S. in the year 1978.Table 19.1
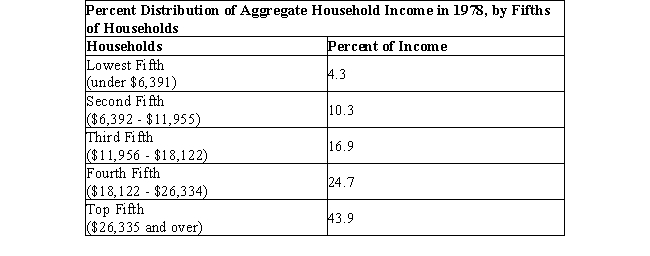
-Refer to Table 19.1. What percentage of income is received by the bottom 20% of the households?
A) 10.3%
B) 43.9%
C) 24.7%
D) 4.3%
E) 16.9%
Correct Answer:
Verified
Q2: The figure given below represents an imperfectly
Q3: The figure given below represents an imperfectly
Q4: The figure given below represents an imperfectly
Q5: The figure given below represents an imperfectly
Q6: The table below shows the distribution of
Q7: The figure given below represents an imperfectly
Q8: The figure given below represents an imperfectly
Q9: The table below shows the distribution of
Q10: The figure given below represents an imperfectly
Q11: The figure given below represents an imperfectly
Unlock this Answer For Free Now!
View this answer and more for free by performing one of the following actions

Scan the QR code to install the App and get 2 free unlocks

Unlock quizzes for free by uploading documents