The table below shows the distribution of income in the U.S. in the year 1978.Table 19.1
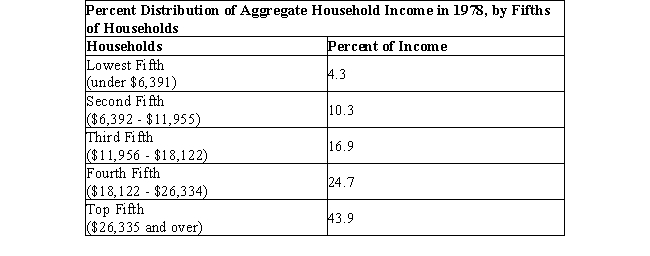
-If a Lorenz curve is drawn using the data in Table 19.1, it will:
A) coincide with the line of perfect equality.
B) be an L-shaped curve.
C) bow above the line of perfect equality.
D) bow down below the line of perfect equality.
E) be a rectangular-shaped curve.
Correct Answer:
Verified
Q15: The figure given below represents an imperfectly
Q16: The figure given below represents an imperfectly
Q17: The figure given below represents an imperfectly
Q18: The figure given below represents an imperfectly
Q19: The figure given below represents an imperfectly
Q21: The figure given below shows the Lorenz
Q22: The figure given below shows the Lorenz
Q23: The figure given below shows the Lorenz
Q24: The figure given below shows the Lorenz
Q25: The figure given below shows the Lorenz
Unlock this Answer For Free Now!
View this answer and more for free by performing one of the following actions

Scan the QR code to install the App and get 2 free unlocks

Unlock quizzes for free by uploading documents