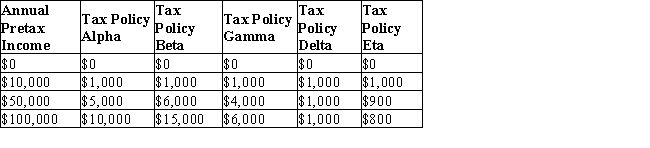
The table given below shows the absolute tax amounts under five different tax policies for respective income levels.Table 19.2
-Rising income inequality is driven by:
A) an increase in employment in the manufacturing sector of an economy.
B) a progressive tax structure.
C) a rising demand for unskilled, cheap labor.
D) a technological advancement.
E) a fall in capital's share of national income.
Correct Answer:
Verified
Q70: The table given below shows the absolute
Q71: The table given below shows the absolute
Q72: The table given below shows the absolute
Q73: The table given below shows the absolute
Q74: The table given below shows the absolute
Q76: The table given below shows the absolute
Q77: The table given below shows the absolute
Q78: The table given below shows the absolute
Q79: The table given below shows the absolute
Q80: The table given below shows the absolute
Unlock this Answer For Free Now!
View this answer and more for free by performing one of the following actions

Scan the QR code to install the App and get 2 free unlocks

Unlock quizzes for free by uploading documents