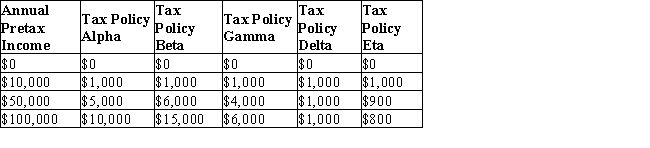
The table given below shows the absolute tax amounts under five different tax policies for respective income levels.Table 19.2
-The farther the Lorenz curve from the line of perfect equality, the lower is the income inequality.
Correct Answer:
Verified
Q63: The table given below shows the absolute
Q64: The table given below shows the absolute
Q65: The table given below shows the absolute
Q66: The table given below shows the absolute
Q67: The table given below shows the absolute
Q69: The table given below shows the absolute
Q70: The table given below shows the absolute
Q71: The table given below shows the absolute
Q72: The table given below shows the absolute
Q73: The table given below shows the absolute
Unlock this Answer For Free Now!
View this answer and more for free by performing one of the following actions

Scan the QR code to install the App and get 2 free unlocks

Unlock quizzes for free by uploading documents