The first panel in the following figure shows the domestic demand (D) and supply (S) curves of Columbian coffee and the second panel shows the import demand and export supply of Columbian coffee in the international market.Figure 20.1
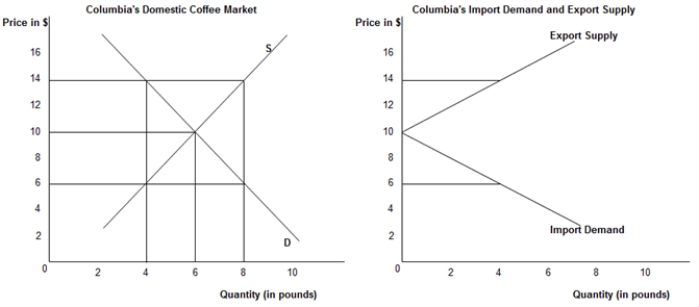
-The import demand curve shows the amount of the home country's:
A) surplus at various prices below the "no-trade" equilibrium.
B) shortage at various prices below the "no-trade" equilibrium.
C) equilibrium "no-trade" quantity demanded.
D) surplus at various prices above the "no-trade" equilibrium.
E) shortage at various prices above the "no-trade" equilibrium.
Correct Answer:
Verified
Q54: The first panel in the following figure
Q55: Scenario 20.2
Suppose labor productivity differences are the
Q56: The first panel in the following figure
Q57: The following table shows that in one
Q58: Scenario 20.2
Suppose labor productivity differences are the
Q60: Scenario 20.2
Suppose labor productivity differences are the
Q61: The table below shows the quantity demanded
Q62: The table below shows the quantity demanded
Q63: The table below shows the quantity demanded
Q64: The table below shows the quantity demanded
Unlock this Answer For Free Now!
View this answer and more for free by performing one of the following actions

Scan the QR code to install the App and get 2 free unlocks

Unlock quizzes for free by uploading documents