The figure below shows the demand (D) and supply (S) curves of a good produced domestically in an economy as well as traded in the international market.Figure 21.1
In the figure,
P1: Price of the good in the international market.P2: Price of the good in the domestic market after the imposition of tariff by the government.P3: No-trade price of the good in the domestic market. 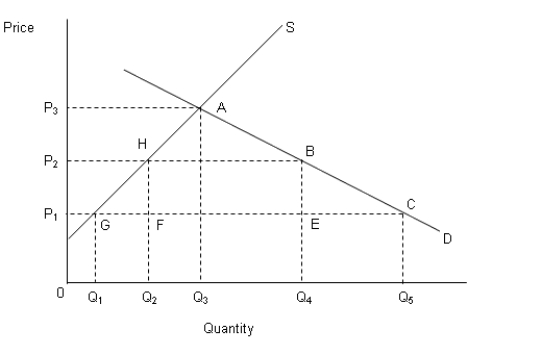
-Refer to Figure 21.1. If the government imposes a tariff such that the price of the good in the domestic market is P2 when the international price is P1:
A) the government revenue will equal the area represented by the triangle HFG.
B) the quantity of the good imported by the domestic country declines.
C) the quantity of the good exported by the domestic country declines.
D) the domestic market achieves equilibrium.
E) the government revenue will equal the area represented by the triangle ABH.
Correct Answer:
Verified
Q21: The figure below shows the demand (D)
Q22: The table below shows the quantity demanded
Q23: The figure below shows the demand (D)
Q24: The table below shows the quantity demanded
Q25: The figure below shows the demand (D)
Q27: The figure below shows the demand (D)
Q28: The figure below shows the demand (D)
Q29: The table below shows the quantity demanded
Q30: The table below shows the quantity demanded
Q31: The table below shows the quantity demanded
Unlock this Answer For Free Now!
View this answer and more for free by performing one of the following actions

Scan the QR code to install the App and get 2 free unlocks

Unlock quizzes for free by uploading documents