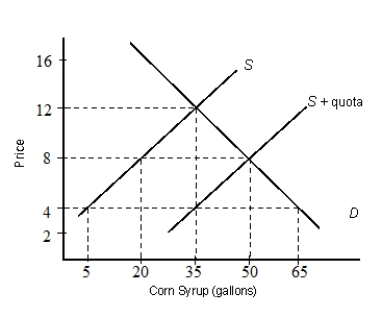
The figure below shows the demand (D) and supply (S) curves of corn syrups.Figure 21.3
-In 1992, the EEC was replaced by the EU with an agreement to:
A) erect strong trade barriers among the member countries.
B) reduce trade barriers against nonmember countries.
C) mutually restrict all imports from nonmember countries.
D) create a single market for goods and services in western Europe.
E) enable the countries of Western Europe to emerge as major world powers.
Correct Answer:
Verified
Q68: The figure below shows the demand (D)
Q69: The figure below shows the demand (D)
Q70: The figure below shows the demand (D)
Q71: The figure below shows the demand (D)
Q72: The figure below shows the demand (D)
Q74: The figure below shows the demand (D)
Q75: The figure below shows the demand (D)
Q76: The figure below shows the demand (D)
Q77: The figure below shows the demand (D)
Q78: The figure below shows the demand (D)
Unlock this Answer For Free Now!
View this answer and more for free by performing one of the following actions

Scan the QR code to install the App and get 2 free unlocks

Unlock quizzes for free by uploading documents