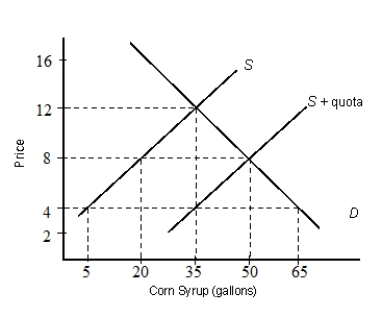
The figure below shows the demand (D) and supply (S) curves of corn syrups.Figure 21.3
-The most successful free trade agreements achieve all of the following goals, except:
A) benefiting exporters by increasing exports to member countries.
B) increasing the volume of trade without changing the pattern of trade.
C) benefiting consumers by making a wider variety of goods available at a lower price.
D) stimulating trade creation to allow the benefits of trade to be realized.
E) protecting domestic industries from foreign competition.
Correct Answer:
Verified
Q74: The figure below shows the demand (D)
Q75: The figure below shows the demand (D)
Q76: The figure below shows the demand (D)
Q77: The figure below shows the demand (D)
Q78: The figure below shows the demand (D)
Q80: The figure below shows the demand (D)
Q81: The figure below shows the demand (D)
Q82: The figure below shows the demand (D)
Q83: The figure below shows the demand (D)
Q84: The figure below shows the demand (D)
Unlock this Answer For Free Now!
View this answer and more for free by performing one of the following actions

Scan the QR code to install the App and get 2 free unlocks

Unlock quizzes for free by uploading documents