The figure given below depicts the demand and supply of Brazilian reals in the foreign exchange market. Assume that the market operates under a flexible exchange rate regime.Figure 22.1
In the figure:
D1 and D2: Demand for Brazilian reals
S1 and S2: Supply of Brazilian reals
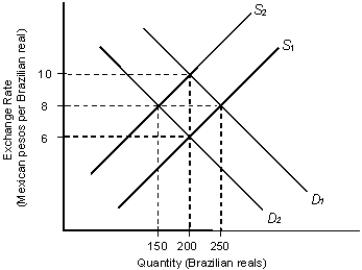
-Refer to Figure 22.1. Assume that the initial equilibrium exchange rate is 6 pesos per real. Other things remaining equal, an increase in the number of Brazilian tourists to Mexico is most likely to:
A) keep the equilibrium exchange rate constant.
B) shift the demand curve for pesos to the right.
C) shift the supply curve of pesos to the left.
D) shift the demand curve for pesos to the left.
E) lower the equilibrium exchange rate.
Correct Answer:
Verified
Q21: The figure given below depicts the demand
Q22: The figure given below depicts the demand
Q23: The figure below shows the demand (D)
Q24: The figure given below depicts the demand
Q25: The figure below shows the demand (D)
Q27: The figure below shows the demand (D)
Q28: The figure below shows the demand (D)
Q29: The figure below shows the demand (D)
Q30: The figure below shows the demand (D)
Q31: The figure below shows the demand (D)
Unlock this Answer For Free Now!
View this answer and more for free by performing one of the following actions

Scan the QR code to install the App and get 2 free unlocks

Unlock quizzes for free by uploading documents