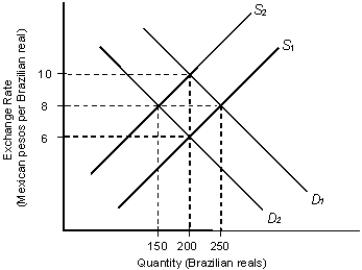
The figure given below depicts the demand and supply of Brazilian reals in the foreign exchange market. Assume that the market operates under a flexible exchange rate regime.Figure 22.1
In the figure:
D1 and D2: Demand for Brazilian reals
S1 and S2: Supply of Brazilian reals
-Suppose you observe that with a given supply curve, the Peruvian demand for Argentinean pesos steadily decreases. This will most likely mean:
A) the supply of Peruvian nuevos soles has increased on the foreign exchange market.
B) the Argentinean peso will appreciate in value relative to the Peruvian nuevo sol.
C) the Argentinean peso will depreciate in value relative to the Peruvian nuevo sol.
D) the Peruvian demand for Argentinean goods has increased.
E) the supply of Argentinean pesos has increased on the foreign exchange market.
Correct Answer:
Verified
Q55: The figure given below depicts the foreign
Q56: The figure given below depicts the foreign
Q57: The figure given below depicts the foreign
Q58: The figure given below depicts the foreign
Q59: The figure given below depicts the foreign
Q61: The figure given below depicts the foreign
Q62: The figure given below depicts the foreign
Q63: The figure given below depicts the foreign
Q64: The figure given below depicts the foreign
Q65: The figure given below depicts the foreign
Unlock this Answer For Free Now!
View this answer and more for free by performing one of the following actions

Scan the QR code to install the App and get 2 free unlocks

Unlock quizzes for free by uploading documents