The 1999 and 2000 market share data of the three competitors (A,B,and C) in an oligopolistic industry are presented in the following pie charts.Total sales for this industry were $1.5 billion in 1999 and $1.8 billion in 2000. 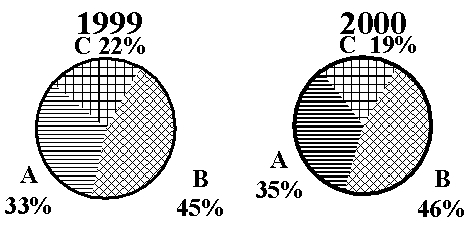 Company B's sales in 1999 were ___.
A) $342 million
B) $630 million
C) $675 million
D) $828 million
E) $928 million
Correct Answer:
Verified
Q42: Consider the following stem and leaf plot:
Q42: Pinky Bauer, Chief Financial Officer of
Q44: Consider the following stem and leaf
Q47: The 1999 and 2000 market share data
Q53: Pinky Bauer, Chief Financial Officer of
Q55: Pinky Bauer, Chief Financial Officer of
Q56: Each day,the office staff at Oasis Quick
Q57: Consider the following stem and leaf plot:
Q57: The 1999 and 2000 market share data
Q59: The following represent the ages of students
Unlock this Answer For Free Now!
View this answer and more for free by performing one of the following actions

Scan the QR code to install the App and get 2 free unlocks

Unlock quizzes for free by uploading documents