The following graphic of residential housing data (selling price and size in square feet) is a ___. 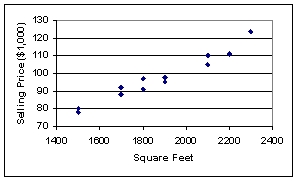
A) scatter plot
B) Pareto chart
C) pie chart
D) cumulative histogram
E) cumulative frequency distribution
Correct Answer:
Verified
Q46: An instructor has decided to graphically represent
Q50: Consider the following stem and leaf plot:
Q56: Each day,the office staff at Oasis Quick
Q57: The 1999 and 2000 market share data
Q60: The 1999 and 2000 market share data
Q62: According to the following graphic the most
Q63: Each day,the office staff at Oasis Quick
Q64: The staff of Mr.Wayne Wertz,VP of Operations
Q65: The staff of Ms.Tamara Hill,VP of Technical
Q66: The staff of Mr.Wayne Wertz,VP of Operations
Unlock this Answer For Free Now!
View this answer and more for free by performing one of the following actions

Scan the QR code to install the App and get 2 free unlocks

Unlock quizzes for free by uploading documents