The following graphic of residential housing data (selling price and size in square feet) indicates ___. 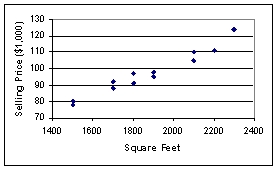
A) an inverse relation between the two variables
B) no relation between the two variables
C) a direct relation between the two variables
D) a negative exponential relation between the two variables
E) a sinusoidal relationship between the two variables
Correct Answer:
Verified
Q64: The staff of Mr.Wayne Wertz,VP of Operations
Q65: The staff of Ms.Tamara Hill,VP of Technical
Q66: The staff of Mr.Wayne Wertz,VP of Operations
Q67: The staff of Ms.Tamara Hill,VP of Technical
Q67: The staffs of the accounting and the
Q68: The staff of Mr.Wayne Wertz,VP of Operations
Q71: The staff of Mr.Wayne Wertz,VP of Operations
Q72: According to the following graphic,"Bent Pins" account
Q73: The following graphic of PCB Failures is
Q74: The staff of Mr.Wayne Wertz,VP of Operations
Unlock this Answer For Free Now!
View this answer and more for free by performing one of the following actions

Scan the QR code to install the App and get 2 free unlocks

Unlock quizzes for free by uploading documents