Exhibit 10.1
The following questions are based on the problem description and the output below.
A college admissions officer wants to evaluate graduate school applicants based on their GMAT scores, verbal and quantitative. Students are classified as either successful or not-successful in their graduate studies. The officer has data on 20 current students, ten of whom are doing very well (Group 1) and ten who are not (Group 2) . 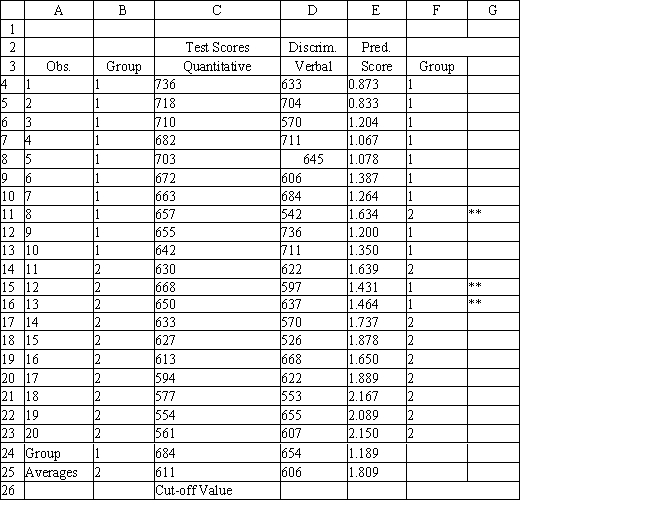
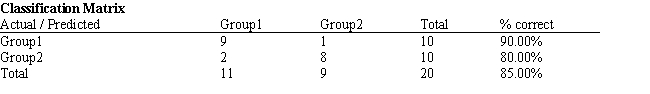
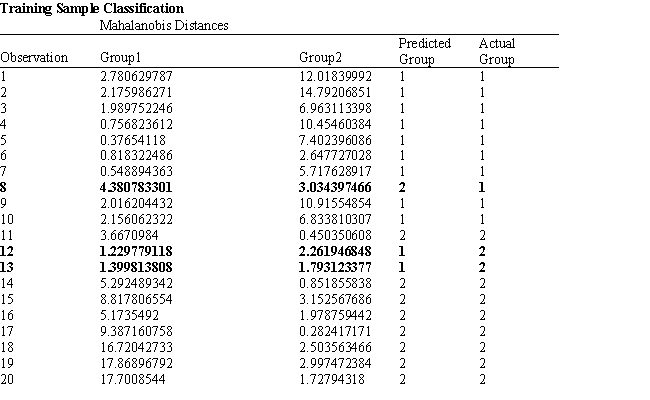
-Refer to Exhibit 10.1. What percentage of the observations is classified incorrectly?
A) 90%
B) 80%
C) 85%
D) 15%
Correct Answer:
Verified
Q11: Exhibit 10.2
The following questions are based on
Q12: Exhibit 10.2
The following questions are based on
Q13: Exhibit 10.2
The following questions are based on
Q14: The Mahalanobis distance measure accounts for differences
Q15: If using the regression tool for two-group
Q17: In hierarchical clustering, the measure of similarity
Q18: The Get Data command is part of
Q19: The k-nearest neighbor (k-NN) technique identifies the
Q20: When purity is perfect, the Gini index
Q21: In discriminant analysis the averages for the
Unlock this Answer For Free Now!
View this answer and more for free by performing one of the following actions

Scan the QR code to install the App and get 2 free unlocks

Unlock quizzes for free by uploading documents