Exhibit 11.11
The following questions use the data below.
Joe's Sporting Goods wants to forecast quarterly sales figures using seasonal indices. The store has collected 12 quarters of data and needs your help to analyze the data. The relevant regression output is in the following table. 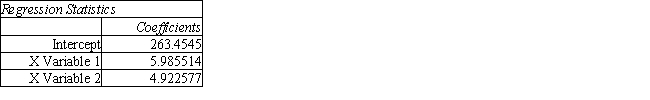
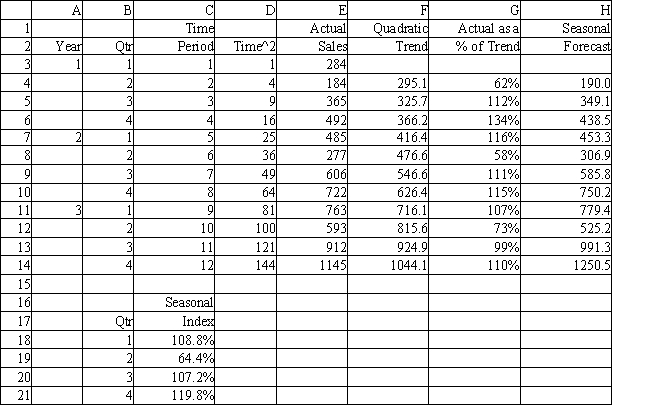
-Refer to Exhibit 11.11. What formula should be entered in cell F3 to compute the quadratic trend for year 1 Quarter 1?
A) = 263.4545 * C3 + 5.985514 * D3 + 4.922577
B) = 263.4545 + 5.985514 * D3 + 4.922577 * C3
C) = 263.4545 + 5.985514 * C2 + 4.922577 * D2
D) = 263.4545 + 5.985514 * C3 + 4.922577 * D3
Correct Answer:
Verified
Q91: Exhibit 11.9
The following questions use the data
Q92: Exhibit 11.9
The following questions use the data
Q93: Exhibit 11.11
The following questions use the data
Q94: Exhibit 11.5
The following questions use the data
Q95: Exhibit 11.12
The following questions use the data
Q97: Exhibit 11.10
The following questions use the data
Q98: Exhibit 11.21
The following questions use the data
Q99: A time series which has no significant
Q100: Exhibit 11.19
The following questions use the data
Q101: Exhibit 11.22
The following questions use the data
Unlock this Answer For Free Now!
View this answer and more for free by performing one of the following actions

Scan the QR code to install the App and get 2 free unlocks

Unlock quizzes for free by uploading documents