Exhibit 13.7
The following questions refer to the information and output below.
A tax accountant has found that the time to serve a customer has a mean of 30 minutes (or 0.5 hours) and a standard deviation of 6 minutes (or 0.1 hours). Customer arrivals follow a Poisson distribution with an average of 60 minutes between arrivals. The following queuing analysis spreadsheet was developed from this information. 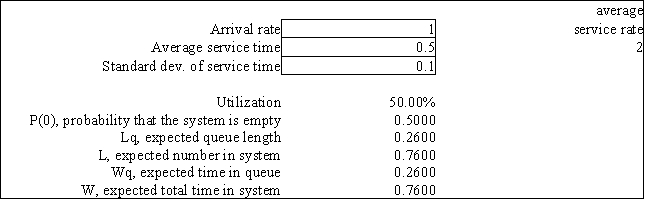
-Refer to Exhibit 13.7. What is the Kendall notation for this system?
Correct Answer:
Verified
Q70: Exhibit 13.1
The following questions are based on
Q71: Exhibit 13.2
The following questions refer to the
Q72: The customer service desk at Joe's Discount
Q73: A grocery clerk can serve 20 customers
Q74: Exhibit 13.6
The following questions refer to the
Q76: Exhibit 13.6
The following questions refer to the
Q77: Exhibit 13.2
The following questions refer to the
Q78: Exhibit 13.5
The following questions refer to the
Q79: Exhibit 13.4
The following questions refer to the
Q80: Exhibit 13.3
The following questions refer to the
Unlock this Answer For Free Now!
View this answer and more for free by performing one of the following actions

Scan the QR code to install the App and get 2 free unlocks

Unlock quizzes for free by uploading documents