Figure L-2
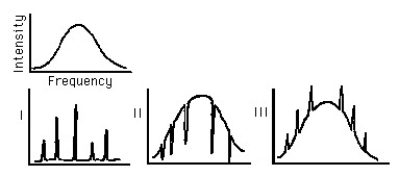
-The radiation curve is a plot of light intensity versus frequency for an incandescent source. If this light is first passed through a cool gas, the resulting radiation curve would most probable look like
A) I)
B) II.
C) III.
This best illustrates that the atoms of gas have
D) been excited.
E) absorbed part of the light.
F) simplified selective frequencies of the transmitted light.
Correct Answer:
Verified
Q30: Figure E/M-4 Q33: Q196: When two lamps are connected in series Q197: A ray of light is incident on Q199: Electric potential energy is measured in Q202: Radioactive isotope A has a half-life of Q203: The ratio of the circumference of any Q204: The "after glow" from some clock faces Q205: The diameter of a mercury atom, atomic Q206: Light from a laser is
![]()
![]()
A)amperes.
B)volts.
C)joules.
D)watts.
And electric
A)monochromatic.
B)in phase.
C)coherent.
D)all of
Unlock this Answer For Free Now!
View this answer and more for free by performing one of the following actions

Scan the QR code to install the App and get 2 free unlocks

Unlock quizzes for free by uploading documents