Figure L-3
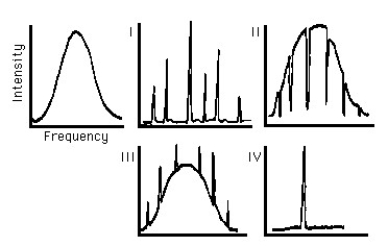
-The radiation curve is a plot of light intensity versus frequency for an incandescent source such as a glowing lamp filament. If the source of light were excited atoms in the gaseous phase, the radiation curve would look like
A) I.
B) II.
C) III.
D) IV.
The plot shown in IV is of
E) monochromatic light.
F) a very bright source.
G) light that has passed through a thin slit.
Correct Answer:
Verified
Q209: The Uncertainty Principle states that
A)all measurements are
Q210: A spectrum of colors seen in gasoline
Q211: A pinhole cameras has no lens. The
Q212: A radioactive isotope has a half-life of
Q213: The thing that is different between x-rays
Unlock this Answer For Free Now!
View this answer and more for free by performing one of the following actions

Scan the QR code to install the App and get 2 free unlocks

Unlock quizzes for free by uploading documents