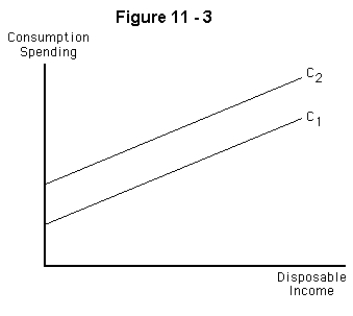
-Refer to Figure 11-3.Which of the following could explain the shift from C1 to C2?
A) An increase in disposable income
B) An increase in net taxes that increases the marginal propensity to consume
C) A decrease in net taxes that increases the marginal propensity to consume
D) An increase in net taxes that increases autonomous consumption spending
E) A decrease in net taxes that increases autonomous consumption spending
Correct Answer:
Verified
Q42: If we know that the slope of
Q44: If real consumption spending increases by $400
Q45: If net taxes were lowered from $5,000
Q46: What are the marginal propensity to consume
Q50: If the interest rate increased,which of the
Q51: An upward shift of the consumption function
Q53: A movement along the consumption-function line would
Q55: The slope of the consumption function can
Q56: If net taxes decrease by $500 billion,both
Q60: Which of the following would lead to
Unlock this Answer For Free Now!
View this answer and more for free by performing one of the following actions

Scan the QR code to install the App and get 2 free unlocks

Unlock quizzes for free by uploading documents