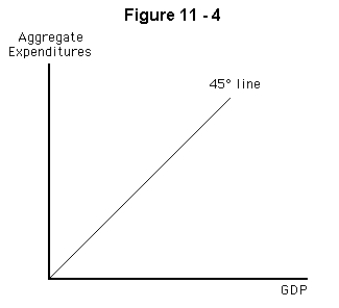
-The graph shown in Figure 11-4 shows
A) equilibrium in the short-run macro model
B) when inventories will accumulate and when they will shrink
C) how an increase in GDP will increase government tax revenues
D) how an increase in aggregate expenditure will increase GDP
E) every point at which aggregate expenditure equals GDP
Correct Answer:
Verified
Q79: If aggregate expenditure exceeds GDP,we expect inventories
Q80: Aggregate expenditure is the sum of
A) all
Q81: In the short-run macro model,if aggregate expenditure
Q82: If aggregate expenditure is less than GDP,inventories
Q83: If aggregate expenditure was less than GDP,which
Q85: In the short-run macro model,if firms produce
Q86: The equilibrium level of GDP can be
Q87: Which of the following is an important
Q88: To construct a graph that would enable
Q89: Equilibrium GDP is reached when
A) aggregate expenditure
Unlock this Answer For Free Now!
View this answer and more for free by performing one of the following actions

Scan the QR code to install the App and get 2 free unlocks

Unlock quizzes for free by uploading documents