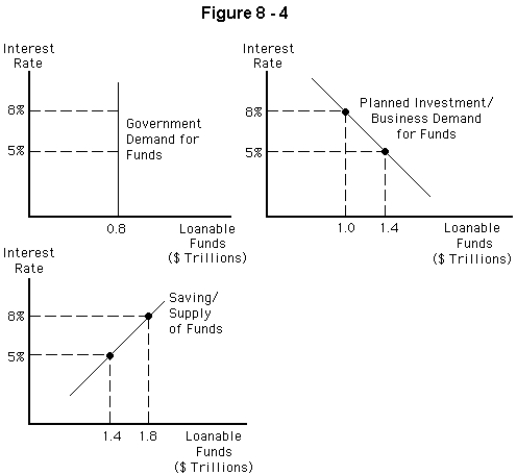
-Refer to Figure 8-4.Based on these graphs,what is the total quantity of loanable funds demanded at an interest rate of 5 percent?
A) $0.8 trillion
B) $1.0 trillion
C) $1.4 trillion
D) $1.8 trillion
E) $2.2 trillion
Correct Answer:
Verified
Q100: Households make their savings available to borrowers
Q101: If at an interest rate of 7
Q102: Q103: Suppose there are no firms,only the government Q104: In the classical model,if the amount households Q106: Investment spending is inversely related to the Q107: The supply of loanable funds curve is Q108: When represented graphically,the government's demand for funds Q109: The relationship between household saving and business Q110: In the classical model,investment spending is![]()
A) positively
Unlock this Answer For Free Now!
View this answer and more for free by performing one of the following actions

Scan the QR code to install the App and get 2 free unlocks

Unlock quizzes for free by uploading documents