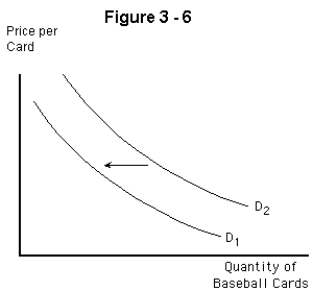
-Assuming that baseball and football cards are substitutes.What might explain the shift in demand curve for baseball cards from D2 to D1 in Figure 3-6?
A) an increase in the price of baseball cards
B) a decrease in the price of baseball cards
C) an increase in income (assuming that baseball cards are a normal good)
D) an increase in the population
E) a decrease in the price of football cards
Correct Answer:
Verified
Q41: Q42: Which of the following could cause the Q43: Which of the following would not cause Q44: An increase in the population will lead Q45: Which of the following would shift the Q47: When there is a change in demand, Q48: The economic model of demand Q50: A good is said to be a Q55: Betsy graduates from college,where she earned $3,000 Q59: Income is to wealth as![]()
A)
A) explains the
A) hours are
Unlock this Answer For Free Now!
View this answer and more for free by performing one of the following actions

Scan the QR code to install the App and get 2 free unlocks

Unlock quizzes for free by uploading documents