Figure 3-8 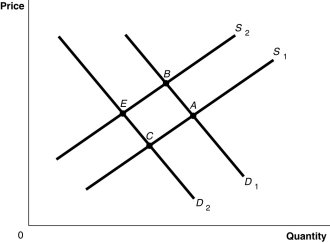
-Refer to Figure 3-8.The graph in this figure illustrates an initial competitive equilibrium in the market for apples at the intersection of D1 and S1 (point A) .If there is an increase in the wages of apple workers and an increase in the price of oranges,a substitute for apples,the equilibrium could move to which point?
A) none of the points shown
B) B
C) C
D) E
Correct Answer:
Verified
Q161: Refer to Figure 3-8. The graph in
Q175: Figure 3-8 Q179: Figure 3-8 Q180: Figure 3-8 Q184: Assume that both the demand curve and Q185: Assume that the demand curve for MP3 Q195: Assume that the demand curve for MP3 Q217: A decrease in the equilibrium price for Q385: Figure 3-8 Q391: Let D = demand, S = supply, Unlock this Answer For Free Now! View this answer and more for free by performing one of the following actions Scan the QR code to install the App and get 2 free unlocks Unlock quizzes for free by uploading documents![]()
![]()
![]()
![]()

