Figure 4.9 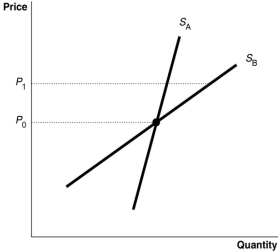
-Refer to Figure 4.9.The diagram shows two supply curves, SA and SB.As price rises from P0 to P1, which supply curve is more elastic?
A) SA
B) SB
C) They are equally inelastic.
D) They are equally elastic.
Correct Answer:
Verified
Q209: The price elasticity of supply is usually
Q214: Figure 4.9 Q263: Suppose the supply of bicycles is price Q264: The price elasticity of supply of hot Q268: To calculate the price elasticity of supply, Q271: Suppose when the price of jean-jackets increased Q273: A supply curve that is vertical Q275: If a supply curve is a horizontal Q285: Suppose the supply curve for digital cameras Q286: Which of the following statements is true?![]()
A)is perfectly
A)The
Unlock this Answer For Free Now!
View this answer and more for free by performing one of the following actions

Scan the QR code to install the App and get 2 free unlocks

Unlock quizzes for free by uploading documents