Figure 7.11 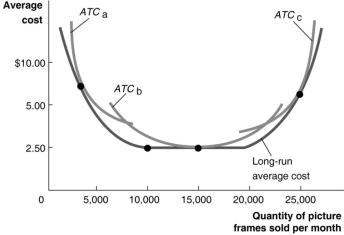 Figure 7.11 illustrates the long-run average cost curve for a firm that produces picture frames.The graph also includes short-run average cost curves for three firm sizes: ATCa, ATCb and ATCc.
-Refer to Figure 7.11.For output rates greater than 20 000 picture frames per month,
A) the firm will not make a profit because the average cost of production will be too high.
B) the firm will experience diseconomies of scale.
C) the firm will experience diminishing returns.
D) the short-run average total cost will equal the long-run average total cost of production.
Correct Answer:
Verified
Q222: Which of the following is not a
Q226: Figure 7.10 Q226: If a firm's long-run average total curve![]()
Unlock this Answer For Free Now!
View this answer and more for free by performing one of the following actions

Scan the QR code to install the App and get 2 free unlocks

Unlock quizzes for free by uploading documents