Figure 9.3 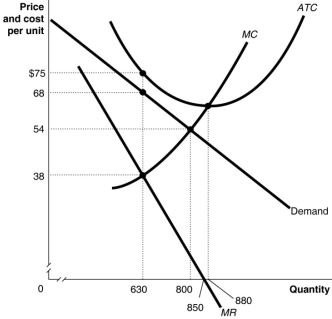 Figure 9.3 above shows the demand and cost curves facing a monopolist.
-Refer to Figure 9.3.What happens to the monopolist represented in the diagram in the long run?
A) It will raise its price at least until it breaks even.
B) If the cost and demand curves remain the same, it will exit the market.
C) The government will subsidise the monopoly to enable it to break even.
D) It will be forced out of business by more efficient producers.
Correct Answer:
Verified
Q79: Figure 9.2 Q81: Long-run economic profits would most likely exist Q82: Figure 9.4 Q83: Wendell can sell five motor homes per Q83: Microsoft hires marketing and sales specialists to Q85: What do economists call firms that face Q87: Figure 9.4 Q88: What is a price maker? Q89: Figure 9.3 Q108: Which of the following is true for Unlock this Answer For Free Now! View this answer and more for free by performing one of the following actions Scan the QR code to install the App and get 2 free unlocks Unlock quizzes for free by uploading documents![]()
![]()
![]()
A)a person who![]()

