Figure 5-5 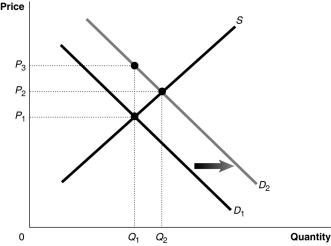 Figure 5-5 shows a market with an externality. The current market equilibrium output of Q1 is not the economically efficient output. The economically efficient output is Q2.
-Refer to Figure 5-5. Suppose the current market equilibrium output of Q1 is not the economically efficient output because of an externality. The economically efficient output is Q2. In that case, the diagram shows
A) the effect of a subsidy granted to producers of a good.
B) the effect of an excess demand in a market.
C) the effect of a positive externality in the consumption of a good.
D) the effect of a negative externality in the consumption of a good.
Correct Answer:
Verified
Q71: When there is a positive externality in
Q75: Article Summary
According to a study by the

