Essay
The graph below represents the market for alfalfa. The equilibrium price is $7.00 per bushel, but the market price is $9.00 per bushel. Identify the areas representing consumer surplus, producer surplus, and deadweight loss at the equilibrium price of $7.00 and at the market price of $9.00. 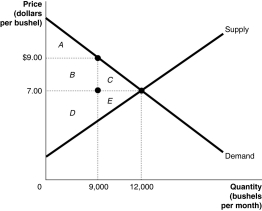
Correct Answer:
Verified
At the equilibrium price of $7.00:
Consu...
Consu...
View Answer
Unlock this answer now
Get Access to more Verified Answers free of charge
Related Questions

