Figure 4-20 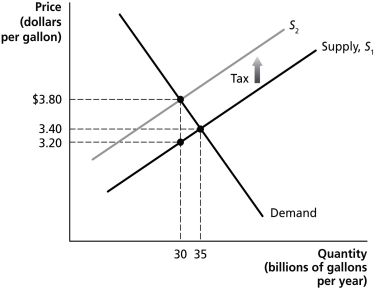
-Refer to Figure 4-20. The figure above represents demand and supply in the market for gasoline. Use the diagram to answer the following questions.
a. How much is the government tax on each gallon of gasoline?
b. What portion of the unit tax is paid by consumers?
c. What portion of the unit tax is paid by producers?
d. What is the quantity sold after the imposition of the tax?
e. What is the after-tax revenue per gallon received by producers?
f. What is the total tax revenue collected by the government?
g. What is the value of the excess burden of the tax?
h. Is this gasoline tax efficient?
Correct Answer:
Verified
b. Consumer bu...
View Answer
Unlock this answer now
Get Access to more Verified Answers free of charge
Q193: Using a supply and demand graph,illustrate the
Q381: The following equations represent the demand and
Q385: If the quantity of donuts supplied is
Q389: If the quantity of sunglasses supplied is
Q390: If the quantity of fishing poles demanded
Q392: Table 4-12 Q394: Table 4-12 Q397: The following equations represent the demand and Q398: Figure 4-21 Q400: Table 4-11 Unlock this Answer For Free Now! View this answer and more for free by performing one of the following actions Scan the QR code to install the App and get 2 free unlocks Unlock quizzes for free by uploading documents
![]()
![]()
![]()
![]()

