Figure 3-7 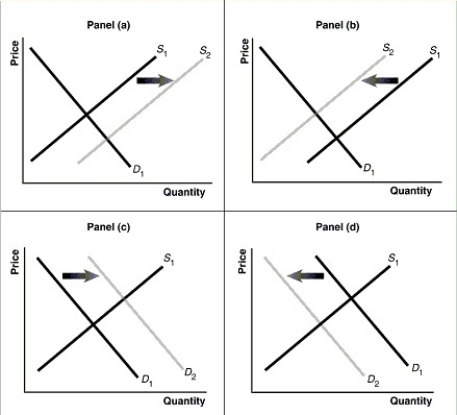
-Refer to Figure 3-7. Assume that the graphs in this figure represent the demand and supply curves for mustard and that bratwurst and mustard are complements. Which panel describes what happens in this market when the price of bratwurst falls?
A) Panel (a)
B) Panel (b)
C) Panel (c)
D) Panel (d)
Correct Answer:
Verified
Q184: Figure 3-7 Q186: An increase in input costs in the Q190: Figure 3-7 Q192: Positive technological change in the production of Q193: Figure 3-7 Q196: Assume that both the demand curve and Q198: An increase in the demand for lobster Q199: Figure 3-7 Q200: A decrease in the demand for soft Q200: Figure 3-7 Unlock this Answer For Free Now! View this answer and more for free by performing one of the following actions Scan the QR code to install the App and get 2 free unlocks Unlock quizzes for free by uploading documents![]()
![]()
![]()
![]()
![]()

