Multiple Choice
Figure 3-8 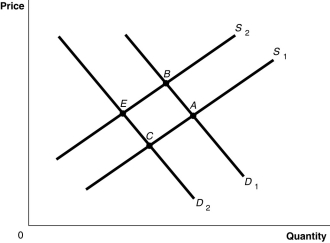
-Refer to Figure 3-8. The graph in this figure illustrates an initial competitive equilibrium in the market for motorcycles at the intersection of D1 and S2 (point
A) A
B) B
B) . f there is an increase in number of companies producing motorcycles and a decrease in income (assume motorcycles are a normal good) , the equilibrium could move to which point?
C) C
D) E
Correct Answer:
Verified
Related Questions

