Figure 27-3 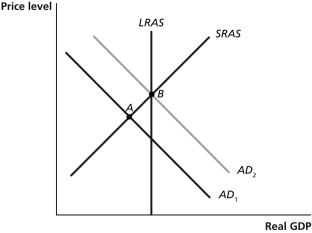
-Refer to Figure 27-3. In the graph above, suppose the economy is initially at point A. The movement of the economy to point B as shown in the graph illustrates the effect of which of the following policy actions by the Congress and the president?
A) a decrease in income taxes
B) a decrease in interest rates
C) a decrease in government purchases
D) an increase in the money supply
Correct Answer:
Verified
Q61: Which of the following is considered expansionary
Q66: Contractionary fiscal policy to prevent real GDP
Q69: If the economy is growing beyond potential
Q73: Figure 27-4 Q75: Figure 27-2 Q75: Expansionary fiscal policy to prevent real GDP Q77: Which of the following is an appropriate Q84: Which of the following would be most Q90: Figure 27-6 Q95: Figure 27-5 Unlock this Answer For Free Now! View this answer and more for free by performing one of the following actions Scan the QR code to install the App and get 2 free unlocks Unlock quizzes for free by uploading documents![]()
![]()
![]()
![]()

