Multiple Choice
Figure 27-10 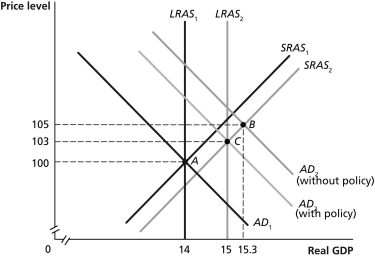
-Refer to Figure 27-10. In the graph above, suppose the economy in Year 1 is at point A and expected in Year 2 to be at point B. Which of the following policies could the Congress and the president use to move the economy to point C?
A) increase income taxes
B) increase government spending
C) buy Treasury bills
D) decrease the discount rate
Correct Answer:
Verified
Related Questions
Q86: Identify each of the following as (i)part
Q87: The problem typically during a recession is
Q88: From an initial long-run equilibrium,if aggregate demand
Q99: Expansionary fiscal policy is used to increase

