Figure 27-11 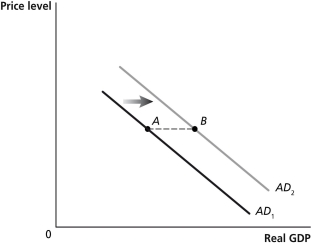
-Refer to Figure 27-11. If government purchases increase by $100 billion and lead to an ultimate increase in aggregate demand as shown in the graph below, the difference in real GDP between point A and point B will be
A) $100 billion.
B) less than $100 billion.
C) more than $100 billion.
D) There is insufficient information given here to draw a conclusion.
Correct Answer:
Verified
Q122: The multiplier effect refers to the series
Q124: The aggregate demand curve will shift to
Q124: Use the dynamic aggregate demand and aggregate
Q125: Economists refer to the series of induced
Q126: Figure 27-11 Q128: Suppose the government spending multiplier is 2.The![]()
Unlock this Answer For Free Now!
View this answer and more for free by performing one of the following actions

Scan the QR code to install the App and get 2 free unlocks

Unlock quizzes for free by uploading documents