Figure 26-9 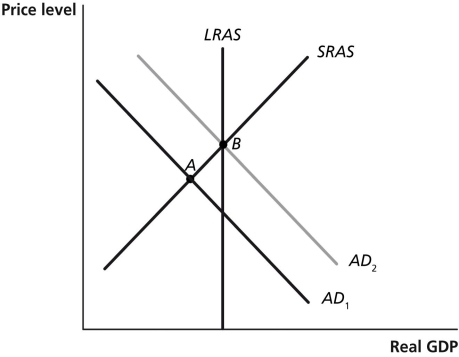
-Refer to Figure 26-9. In the figure above suppose the economy is initially at point A. The movement of the economy to point B as shown in the graph illustrates the effect of which of the following policy actions by the Federal Reserve?
A) a decrease in income taxes
B) an increase in the required reserve ratio
C) an open market purchase of Treasury bills
D) an open market sale of Treasury bills
Correct Answer:
Verified
Q114: When the Fed uses contractionary policy
A)the price
Q117: Figure 26-6 Q118: Your roommate is having trouble grasping how Q119: Figure 26-7 Q123: If the Fed lowers its target for Q124: In which of the following situations would Q126: Falling interest rates can Q126: Article Summary Q128: When the Fed increases the money supply Q133: Contractionary monetary policy causes![]()
![]()
A)increase a firm's stock
With global borrowing costs so low,
A)the
A)aggregate demand to rise
Unlock this Answer For Free Now!
View this answer and more for free by performing one of the following actions

Scan the QR code to install the App and get 2 free unlocks

Unlock quizzes for free by uploading documents