Multiple Choice
Figure 2-16 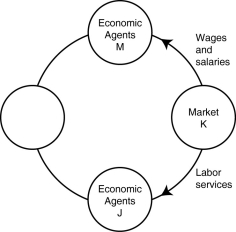
-Refer to Figure 2-16. One segment of the circular flow diagram in the figure shows the flow of wages and salaries from market K to economic agents M. What is market K and who are economic agents M?
A) K = factor markets; M = households
B) K = product markets; M = households
C) K = factor markets; M = firms
D) K = product markets; M = firms
Correct Answer:
Verified
Related Questions
Q176: Is it possible for a firm to
Q181: The natural resources used in production are
Q214: Which of the following is a flow
Q375: Suppose in Belgium,the opportunity cost of producing

