Multiple Choice
Figure 2-16 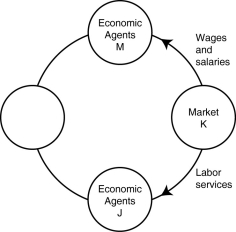
-Refer to Figure 2-16. In the circular flow diagram, market K represents
A) households.
B) product markets.
C) firms.
D) factor markets.
Correct Answer:
Verified
Related Questions
Q176: Is it possible for a firm to
Q181: The natural resources used in production are
Q192: Which of the following is a factor
Q214: Which of the following is a flow
Q375: Suppose in Belgium,the opportunity cost of producing
Q377: Table 2-21 Q382: Figure 2-16 Q383: Which of the following statements about an Q384: Figure 2-18 Q386: Figure 2-16 Unlock this Answer For Free Now! View this answer and more for free by performing one of the following actions Scan the QR code to install the App and get 2 free unlocks Unlock quizzes for free by uploading documents
![]()
![]()
![]()
![]()

