Essay
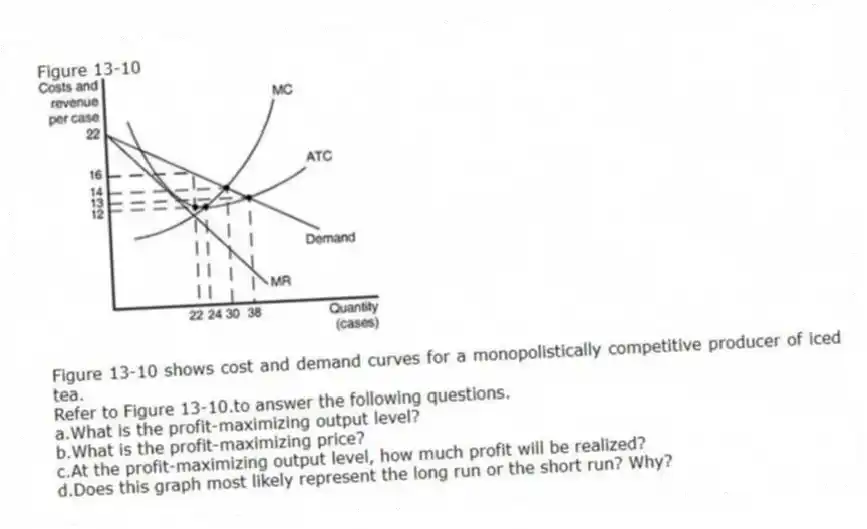
Figure 13-10
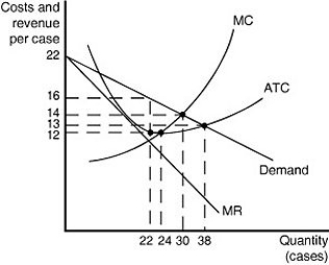
Figure 13-10 shows cost and demand curves for a monopolistically competitive producer of iced tea.
-Refer to Figure 13-10.to answer the following questions.
a.What is the profit-maximizing output level?
b.What is the profit-maximizing price?
c.At the profit-maximizing output level, how much profit will be realized?
d.Does this graph most likely represent the long run or the short run? Why?
Correct Answer:
Verified
a.The profit-maximizing output...
View Answer
Unlock this answer now
Get Access to more Verified Answers free of charge
Related Questions
Q103: If a perfectly competitive firm maximizes short-run
Q104: A monopolistically competitive firm should lower its
Q105: Unlike a perfectly competitive firm, a monopolistic
Q106: For a monopolistically competitive firm, price equals

