Table 10-2
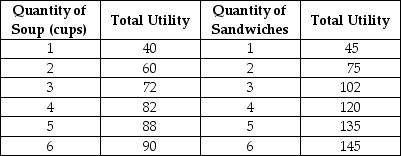 Table 10-2 above shows Keira's utility from soup and sandwiches. The price of soup is $2 per cup and the price of a sandwich is $3. Keira has $18 to spend on these two goods.
-Refer to Table 10-2. Holding prices constant, when Keira's income changes from $18 to $23, what happens to her total utility and to the marginal utilities of the last cup of soup and the last sandwich purchased?
A) Her total utility increases, but the marginal utilities of the last cup of soup and the last sandwich consumed decrease.
B) Her total utility, the marginal utility of the last cup of soup consumed and the marginal utility of the last sandwich consumed, all increase.
C) Her total utility decreases, but the marginal utilities of the last cup of soup and the last sandwich consumed increase.
D) Her total utility and the marginal utility of the last cup of soup consumed increase, but marginal utility of the last sandwich consumed decreases.
E) Her total utility and the marginal utility of the last sandwich consumed increase, but marginal utility of the last cup of soup consumed decreases.
Correct Answer:
Verified
Q43: Suppose the marginal utilities for the first
Q46: Table 10-2 Q47: Consider a downward-sloping demand curve.When the price Q48: The word "util" has been used by Q49: The satisfaction a person receives from consuming Q53: If marginal utility of apples is diminishing Q55: Consider a downward-sloping demand curve.When the price
![]()
Unlock this Answer For Free Now!
View this answer and more for free by performing one of the following actions

Scan the QR code to install the App and get 2 free unlocks

Unlock quizzes for free by uploading documents