Which acid-base combination is depicted by this titration curve? The dot on the curve is located at the titrant volume where the titration solution pH equals 7. 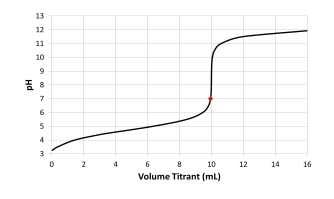
A) Titration of a weak acid with a strong base.
B) Titration of a strong acid with a strong base.
C) Titration of a weak base with a strong acid.
D) Titration of a strong base with a strong acid.
E) Not enough information provided.
Correct Answer:
Verified
Q24: A buffer is composed of 0.400 mol
Q25: You have 75.0 mL of 0.11
Q26: What molar ratio of acetic acid
Q27: If 0.50 L of a buffer containing
Q29: What is the pH of a
Q29: If the ratio of acid to base
Q31: A volume of 25.0 mL of
Q33: A 50.00-mL solution of 0.0350 M
Q34: What mass of sodium hydroxide must
Q35: How many moles of solid NaF
Unlock this Answer For Free Now!
View this answer and more for free by performing one of the following actions

Scan the QR code to install the App and get 2 free unlocks

Unlock quizzes for free by uploading documents