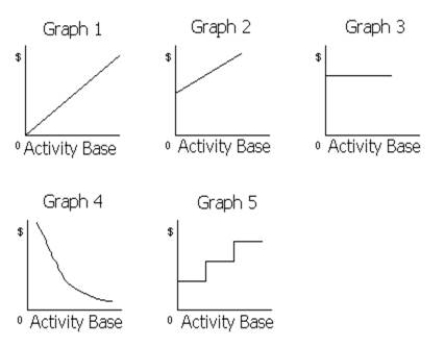
The cost graphs in the illustration below shows various types of cost behaviors.
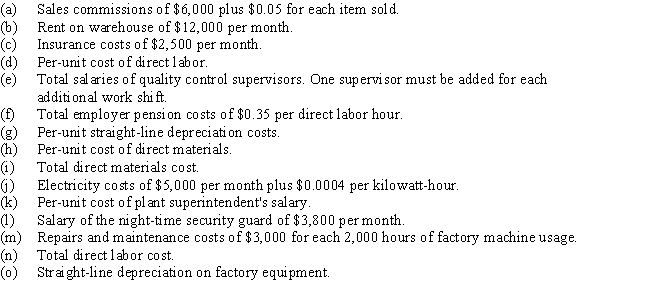
For each of the following costs,identify the cost graph that best describes its cost behavior as the number of units produced and sold increases:
Correct Answer:
Verified
Q177: Global Publishers has collected the following data
Q189: Douglas Company has a contribution margin ratio
Q193: Carrolton, Inc. currently sells widgets for $80
Q194: Louis Company sells a single product at
Q194: Bluegill Company sells 45,000 units at $18
Q195: Gladstorm Enterprises sells a product for $60
Q207: Given the following:
Variable cost as a percentage
Q393: For the current year ending January 31,Harp
Q395: For the current year ending April 30,Hal
Q401: Steven Company has fixed costs of $160,000.The
Unlock this Answer For Free Now!
View this answer and more for free by performing one of the following actions

Scan the QR code to install the App and get 2 free unlocks

Unlock quizzes for free by uploading documents