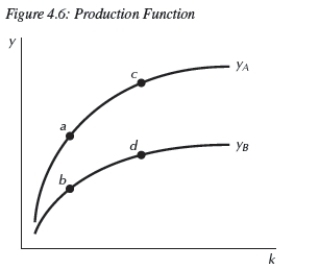
-Consider the two production functions in Figure 4.6,representing two countries.Which of the following is not true?
i.At points a and b,each country has the same per capita capital stock but different factor productivity.
ii.Points a and c represent different countries but with the same factor productivity.
iii.Points b and d represent the same country but with different stock of per capita capital.
A) ii only
B) i only
C) iii only
D) i and ii
E) i and iii
Correct Answer:
Verified
Q70: As a measure for total factor productivity,we
Q71: Which of the following do not explain
Q73: Q74: In the year 2000,the five richest countries Q76: In the United States,the average number of Q77: To decompose what explains the difference in Q78: Q79: You are an economist working for the Q80: Suppose the total factor productivity in Switzerland,Italy,South Q86: Figure 4.6: Production Function Unlock this Answer For Free Now! View this answer and more for free by performing one of the following actions Scan the QR code to install the App and get 2 free unlocks Unlock quizzes for free by uploading documents![]()
![]()
![]()

