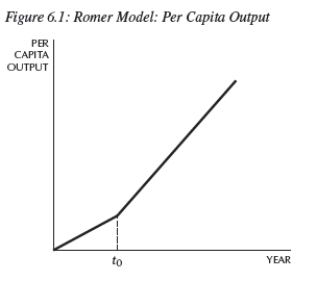
-In the Romer model in Figure 6.1,at time t0,a change in the growth rate of per capita output can be explained by:
A) an increase in the ideas efficiency parameter.
B) an increase in the population.
C) an increase in the research share.
D) an increase in the saving rate.
E) a and b
Correct Answer:
Verified
Q29: In the Romer model, the inputs to
Q32: The reason perfect competition cannot generate new
Q36: Which of the following can be used
Q37: In the Romer model,the production function
Q38: The president of Tunisia asks you to
Q43: Suppose the parameters of the Romer model
Q44: Suppose the parameters of the Romer model
Q45: Idea accumulation in the Romer model exhibits:
A)
Q46: Suppose the parameters of the Romer model
Q52: Nonrivalry in the knowledge sector means that:
A)
Unlock this Answer For Free Now!
View this answer and more for free by performing one of the following actions

Scan the QR code to install the App and get 2 free unlocks

Unlock quizzes for free by uploading documents