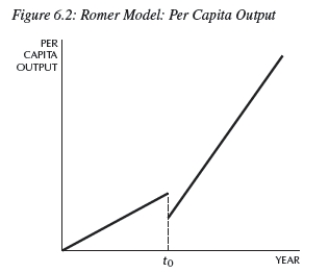
-In the Romer model in Figure 6.2,at time t0,a change in the shape of the production function can be explained by:
A) an increase in the population.
B) an increase in the research share.
C) an increase in the ideas efficiency parameter.
D) an increase in the saving rate.
E) a and b
Correct Answer:
Verified
Q43: In the Romer model, the Mexican economy:
A)
Q50: If East and West Timor are identical
Q51: In the Romer model, _ is the
Q53: Because there are no diminishing returns in
Q54: In the ideas sector production function,
Q57: In the Romer model with decreasing returns
Q58: A balanced growth path is defined as
Q58: The parameter(s) in the Romer model is/are:
A)
Q60: Nonrivalry in the Romer model means that
Q62: In the Romer model, if an economy's
Unlock this Answer For Free Now!
View this answer and more for free by performing one of the following actions

Scan the QR code to install the App and get 2 free unlocks

Unlock quizzes for free by uploading documents