Multiple Choice
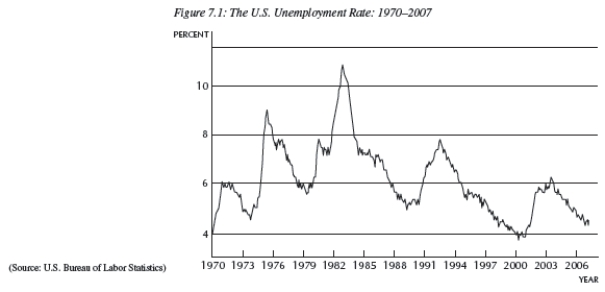
-Using Figure 7.1,which depicts the U.S.unemployment rate,identify the year(s) of the peak of the boom.
A) 1983
B) 1989
C) 2001
D) all of the above
E) none of the above
Correct Answer:
Verified
Related Questions
Q1: Over the past 50 years or so,
A)the
Q3: Q3: Generally, during a recession: Q4: The labor market determines: Unlock this Answer For Free Now! View this answer and more for free by performing one of the following actions Scan the QR code to install the App and get 2 free unlocks Unlock quizzes for free by uploading documents![]()
A) inflation rises.
B) the
A)structural unemployment.
B)the equilibrium quantity

