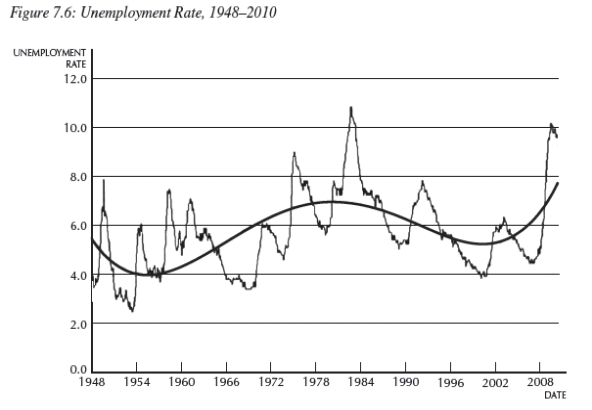
-Consider Figure 7.6,which shows the unemployment rate from 1948-2010.
(a)What does the smooth line represent? How can it be represented?
(b)Based solely on this data,was the period from approximately 1963-1971 an expansion or recession? Explain.What about the period 1981-1986?
(c)Based on the data presented,what is your prediction for future rates of unemployment?
Correct Answer:
Verified
View Answer
Unlock this answer now
Get Access to more Verified Answers free of charge
Q83: Wage rigidity decreases labor market volatility.
Q89: The supply of labor curve slopes upward
Q92: Historically,young French workers (under age 26)have had
Unlock this Answer For Free Now!
View this answer and more for free by performing one of the following actions

Scan the QR code to install the App and get 2 free unlocks

Unlock quizzes for free by uploading documents