Multiple Choice
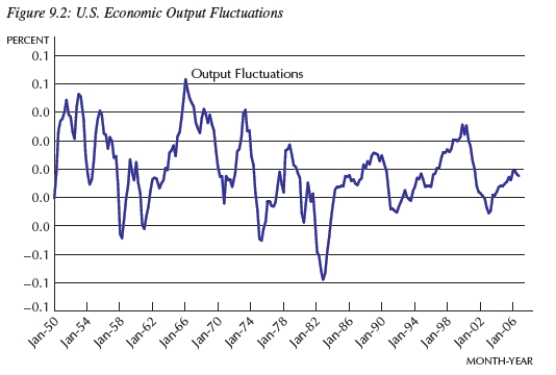
-Consider Figure 9.2.The line represents short-run fluctuations, 
) Since 1950,the largest boom was in about __________ and the deepest recession was in about __________.
A) 1983;1965
B) 1974;1976
C) 2000;1983
D) 1966;1983
E) The economy always produces at its potential.
Correct Answer:
Verified
Related Questions
Q24: According to the text, which of the
Q32: Generally speaking,the rate of inflation _ during
Q32: Which is responsible for dating business cycles?
A)

